ExcelDashboardWidgets

Helping you create stunning dashboards in Microsoft Excel including dials, speedometers, thermometers, and much more...

Post any problems or questions you have with the ExcelDashboardWidgets spreadsheets here.

Moderator: DashboardWidgets

By djhesh
#999
Hello i have new issue. god the speadhseet. looked at ur tutorial on youtube. but when connecting traffic light widget to calculations page. its not making the active light glow. instead it creates a similar color small circle next to it ??????
#1000
Hi djhesh

This occurs in older versions of Microsoft Excel but is very easy to remedy.

The easiest way to help you is if you copy the widget into a new Excel worksheet and upload it onto the forum. We will then make a quick video to show you the steps to remedy the problem using your example as a start.

Take a look at this forum post from two years ago with the same problem in Excel 2003.

http://www.exceldashboardwidgets.com/ph ... =104&p=310

Looking forward to hearing from you.

Cheers

DashboardWidgets
#1003
Hi djhesh

Apologies for the delay - we are a little busy these days.

We took a quick look at the dashboard you uploaded this morning and made this quick video which solves your problems.


Please also find attached the updated dashboard that we fixed in the video.
(78.73 KiB) Downloaded 274 times
If you have any more questions concerning how these widgets should be configured please feel free to get back to us.

Cheers

DashboardWidgets
By djhesh
#1004
Thank you heaps. was a great video and helped me understand how all works. i might have few questions down the track , as this is just the start. i will keep u posted if so.

Much appreciate the time u took to make the video. Very Helpful. :)
By djhesh
#1011
Hello once again :)

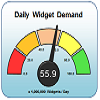
Now that i have got most formulas done. i am trying to connect values to dashboard. i m currently stuck at circular dial widget. Its working fine as long as its within 100%, but with the project i am working on…(PIF- Paid in Full students) % can go over 100%. What i would like to establish is when the target is exceeded, the circle goes over/around and creates a special effect for the additional % achieved. currently its getting stuck at last highest value before 100% (in the uploaded file at 98% view), and just the number updates. can u pls help.

Also to avoid you making future videos. the next step after this will raise questions so might as well ask you no :):
1. so as you see in the enrolment info tab> courses, students could be enrolled in either one of the courses. i would like to be able to emphasise in widget , which is the most productive course on monthly basis , whilst displaying other course revenues achieved over the month period? can i use this using world maps options.. as it looks pretty cool :)

2. if maps don't work with the courses idea, whats ur suggestion to get the desired result as mentioned above and can i then use maps, to display widget, where we can see… enrolments % or values based on australian state (which i enter in enrolment info tab again)

any further ideas and suggestions .pls enrich me.file attached & many thanks in advance.
Attachments
tempate i am working on
(196.1 KiB) Downloaded 271 times
#1067
Hi Djhesh

Once again sorry for the confusion, in reply to your questions.

1. In an earlier post we uploaded a new circular dial widget we designed for you that is able to show values beyond 100%. The widget can be found here... http://www.exceldashboardwidgets.com/ph ... 343#pr1066

2. To show the most productive course on monthly basis (based on revenues received) we would consider a simple bar chart. Alternatively, we could produce a map widget of Australia for you which could show different states in different colour intensity related to their revenues?

Hope this helps.

DashboardWidgets
By djhesh
#1074
Hi Dashboard Widgets

1. With the Circular dial widgets, the circles when opened are too close to each other , due to which doesnt show the full effect ? how can i fix this, guessin its an excel version thing.

2. Australian Maps would be great. All i need to look at is how many students are enrolled frm each state ?? color coding with color display could be great ... if u can send me the widget.

Download and try for free!